
Evaluation of Saltwater Intrusion in Some Coastal Areas in Rivers State, Nigeria
- a University of Port Harcourt
Highlights
- Evaluated saltwater intrusion in six coastal communities in Rivers State using integrated geophysical and hydrochemical techniques.
- Identified low-resistivity zones (0.678–48.8 Ωm) associated with potential saline intrusion.
- Tema Well 2 recorded the highest salinity (3,810 mg/L) and electrical conductivity (7,490 µS/cm).
- Revealed substantial spatial variation, with salinity and sodium hazards concentrated in Tema, Sama, and Ido.
- Recommended regulated groundwater abstraction and continuous geophysical monitoring.
Abstract
This study is to evaluate the three-dimensional hydrogeophysical and hydrochemical architecture of coastal aquifers within the Benin Formation Niger Delta, employing multimethod triangulation of two-dimensional Electrical Resistivity Tomogram (ERT), Advanced Digital Multi-Magnetic Tomogram (ADMT), Vertical Electrical Sounding (VES), and co-located groundwater hydrochemical analysis across six contiguous communities from Sama, Tema, Abalama, Buguma, Ido, and Obuama Area. Geophysical inversion resolves laterally persistent conductive zones (0.678-48.8 Ωm) interpreted as saline wedges and mineralised plumes exploiting paleo channel discontinuities and compromised borehole annuli, with pseudosection convergence substantiating robust inversion fidelity (RMS 1.4-7.6%). Hydrochemically, extreme spatial bifurcation is documented: Tema Well 2 registers electrical conductivity of 7,490 µS/cm, total dissolved solids of 3,750 mg/L, and salinity of 3,810 mg/L, whereas adjacent BH3 maintains pristine conditions (EC 529 µS/cm). The irrigation water quality index delineates a tripartite zonation from excellent to very poor, affirming that vulnerability is structurally controlled by topographic relief and aquifer confinement. Critically, the tomograms reveal encapsulation geometries wherein conductive plumes entirely bound remnant freshwater lenses, creating metastable island architectures subjected to imminent diffusive compromise. These findings affirm that coastal aquifer degradation in the Niger Delta is a process driven, structurally mediated crisis.
Keywords
Introduction
Coastal regions, home to a significant proportion of the world's population, rely heavily on groundwater as a primary source of water supply. However, the management of these vital resources is severely challenged by the pervasive threat of Saltwater Intrusion (SWI), which is one of the most critical forms of groundwater contamination in coastal aquifers worldwide (Abd-Elaty et al., 2017; Abd-Elhamid et al., 2018). SWI occurs when the natural balance between freshwater and denser saltwater is disrupted, leading to the inland migration of seawater into freshwater aquifers, consequently degrading the water quality and limiting its suitability for human consumption and agricultural use.
Coastal areas worldwide face a critical threat to their freshwater security in the form of Saltwater Intrusion, which is widely acknowledged as a leading cause of groundwater quality degradation in these highly populated regions (Abd-Elaty et al., 2017; Abd-Elhamid et al., 2018). Groundwater, often the main source of water in coastal zones, is essential for domestic, agricultural, and industrial consumption. However, the integrity of these aquifers is compromised when the delicate hydrostatic balance between the lighter freshwater and the denser seawater is disturbed, leading to the contamination of potable water supplies. The primary factor driving this disruption is excessive groundwater abstraction, where over-pumping lowers the water table and reverses the natural seaward flow of freshwater, thus allowing the saline front to migrate inland. This issue is further exacerbated by the effects of climate change, particularly the global phenomenon of sea-level rise (Odigie & Obayagbona, 2025).
The
phenomenon of saltwater intrusion is primarily driven by two interrelated
factors: excessive groundwater
abstraction and the impacts of climate
change, particularly sea level rise. As pumping rates increase to meet
rising water demands, the freshwater head is lowered, altering the natural
hydraulic gradient that typically directs freshwater flow toward the sea,
thereby allowing the denser saline water to travel inland (Abd-Elaty et al., 2017). The resulting
contamination necessitates careful and planned withdrawal strategies to protect
these finite groundwater reserves.
The
severity of saltwater intrusion varies significantly by region, often amplified
by local hydrogeological conditions and intensive human activity. Studies
focusing on the Nile Delta in Egypt
highlight the massive scale of the problem, where intrusion has extended over
100 km inland (Abd-Elaty et al.,
2017). Similarly, in Vietnam,
hydrological modeling of the Thach Han River system confirmed that saline water
intrusion affects significant stretches of the river network, with control
measures like increased discharge proving minimally effective (Vuong et al., 2021).
Coastal
impact assessments of groundwater had been carried out by some researchers in
parts of these communities with the aim of assessing fresh water resources
(Ayodele 2003). Related researches, which have given better understanding of
the saline intrusion, had helped the government and its agencies to make good
policies on coastal water resources management.
In
Nigeria, a lot has been done by Lagos state on hydrogeological evaluation of
its ground water resources especially in the coastal areas. Individual
university researchers have also ventured into various works on the subject
matter in the state. For example, carried out 2-D resistivity imaging in other
to determine the groundwater conditions around Iwaya area of Lagos. The result
of the study revealed a high resistivity contrast between the saturated
freshwater zones and low resistivity of the saturated saltwater intrusion zones.
Also, carried out geophysical investigation of saline water intrusion into
freshwater aquifers at Oniru, Lagos State. The results had it that saline water
plumes occurring in different part of the study area. The 2-D resistivity
result showed the saline water intrusion between a depth of 13 and 64 m
(Batayneh, 2006). Carried out integrated geophysical and geochemical
investigations of saline water intrusion in a coastal alluvial terrain,
south-western Nigeria. The depth of inverse models from the geoelectrical
resistivity data obtained in the area revealed significant impact of the saline
water on delineated aquifers with very low resistivity values uniquely below
4.0 Ω m. Is also a good reference in Port Harcourt, existence of saltwater zone
was identified by at a depth of 30 m at and 120 m at Eastern by-Pass areas of
the city. Using 2-D electrical resistivity imaging, the authors identified the
low resistivity zones as the saltwater intruded zones.
Electrical
resistivity method is a very effective technique of studying the environmental
impact assessments of groundwater pollution. Several studies have been carried
out around the world on groundwater pollution, quality, direction of flow and
flow rate using resistivity technique. In locating the groundwater pollution
and monitoring its flow direction, used surface electrical resistivity method
to carry out a field investigation. According to the investigation, there was a
reduction in resistivity values as compared to the resistivity values of the
groundwater of the reference station. The author described the sensitivity of
the method as being dependent on the relative uniformity of the geology and
topography of the area. Electrical resistivity method was also used by for the
purpose of detecting subsurface fresh and saline water and delineating their
interfacial configuration.
Research
in Lagos confirmed that factors such as well elevation are critical in
determining the susceptibility of local water sources to contamination
(Obunadike et al., 2024). Furthermore,
extensive hydro-chemical analysis in areas like Buguma City, Rivers State,
consistently shows that ion concentrations, including chloride and sodium,
exceed established drinking water quality standards, confirming active saline
intrusion (Uzoije et al., 2014).
Groundwater remains the most reliable source of potable water in many coastal communities of Rivers State, Nigeria. With increasing population growth, urbanization, and industrial activities, the demand for groundwater has intensified, placing immense pressure on aquifer systems. Coastal aquifers, however, are inherently vulnerable to saltwater intrusion due to their proximity to tidal rivers and the Atlantic Ocean. The delicate balance between freshwater and saline water, is easily disrupted when groundwater extraction exceeds natural recharge or when sea level rise alters hydraulic gradients. This phenomenon has been observed in several parts of Rivers State, where shallow aquifers are increasingly compromised by saline encroachment (Oghonyon et al., 2024; Dickenson et al., 2022). The present study employed the spatial distribution and delineate the lateral and vertical extent of low resistivity zones and chemical signatures in each community using ERT, VES and sampling and quantify salinity and contamination using hydrochemical parameters with selected metals and infer the degree of seawater mixing intervals.
Materials
and Methods
Study Area and its Geology
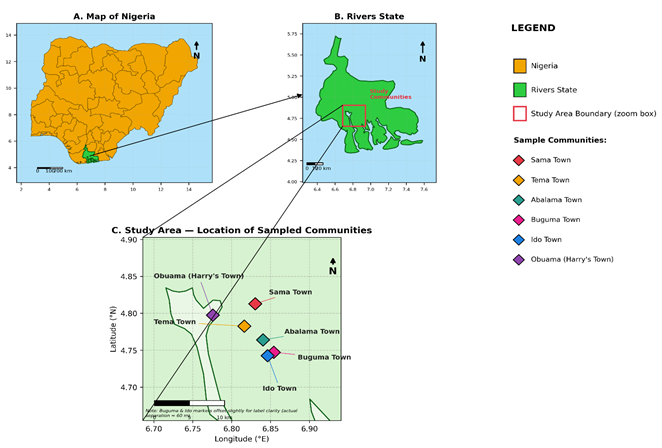
The study area is in Asari-Toru and Degema Local Government Area of Rivers State, Niger Delta Southern Nigeria, which is located between latitudes 4˚ 46'21"N and 4˚22'00"N, and longitudes 4˚2'39"E and 7˚10'27"E. It is marked by two distinct seasons, the dry season and the rainy season (Figure 1).
The dry season lasts from about November to April and while
the rainy season spans May to October with a brief dry spell in August. The
study area has characteristic tropical equatorial climate with mean annual
temperature of 32.8⁰C and annual rainfall of 2673.8 mm. Located in Benin
Formation, Asari-Toru and Degema is typically riverine and has a large number
of outlets through which her tributes from River Niger empty their water into
the Atlantic Ocean. It is predominantly sandy with a few intercalations of
shale beds. The sands are always unconsolidated, granular in texture and
characteristically fine to coarse grained size and described as fresh water
bearing. At various depths in the formation, both confined and unconfined
aquifers are encountered (Figure 1). In this study, electrical resistivity
imaging (tomography) profiling was adopted for the subsurface aquifer
investigation due to saltwater intrusion into freshwater aquifer. The
geophysical equipment used is the ABEM Terrameter 300 C with a Signal Averaging
System (SAS), a method whereby consecutive readings are taken automatically and
the results are averaged continuously.
In this study, electrical resistivity
imaging (tomography) profiling was adopted for the subsurface aquifer
investigation due to saltwater intrusion into freshwater aquifer. The
geophysical equipment used is the ABEM Terrameter 300 C with a Signal Averaging
System (SAS), a method whereby consecutive readings are taken automatically and
the results are averaged continuously. A total of eighteen profile lines were
established for the 2-D resistivity survey. For this study, electrical
resistivity Wenner imaging was adopted (Frohlich et al., 2002). A 200 m
multicore cable with a 10 m take-out interval for Profile 1 and Profile 2 and
100 m multicore cable with a take-out interval of 5 m for Profile 3, Profile 4,
Profile 5 and Profile 6 were used. After taking the first reading at station
one, the cables were moved in a leap-frog manner to the next position of
electrodes 2,3,4 and 5 for the second station reading. This procedure was
repeated until spacing of 2a, 3a, 4a, 5a and 6a was acquired. A total of 18
measurements points were occupied for the eighteen profiles during the 2-D
resistivity survey. The eighteen resistivity profiling data obtained from the
field were processed using a 2-D iterative smoothness constrained least square
inversion technique to create a subsurface model of the resistivity by
inverting the apparent resistivity data. The inverted sections were generation
was done using RES2D inversion software.
Results and Discussion
The nature of the fluid present in the pores of a rock
greatly influences the resistivity of the lithology. To ascertain the extent of
pollution, the resistivity depth section from polluted segment of the study
area was compared with the background value of the control section. The
interpretation should distinguish the relatively resistive topsoil from the
more conductive clayey units and potential saline water bearing zones. Low
electrical resistivity may indicate saline water intrusion; however, clay-rich
sediments can also exhibit low resistivity because of their high surface
conductivity. Consequently, resistivity alone cannot conclusively establish
saltwater contamination without supporting groundwater geochemical analyses.
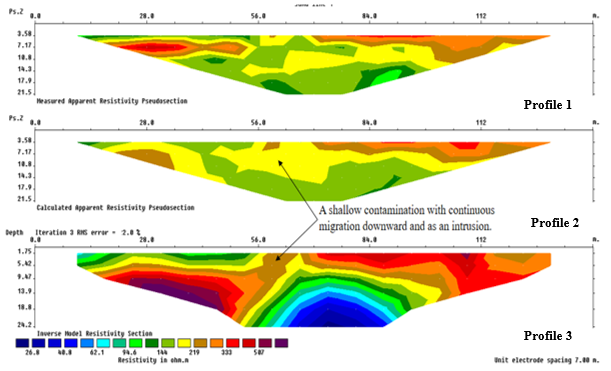
Figure 2: Resistivity plot for profiles.
The supplied inverted section of Profile 1-3 extends to approximately 24.2 m depth. The upper zone, approximately 3.5-7 m deep, exhibits resistivity values broadly ranging from 94.6 to above 333 Ωm, representing relatively resistive topsoil or shallow sediments. Beneath this, the central conductive anomaly extends to approximately 24 m, with resistivity decreasing to 26.8-62.1 Ωm, suggesting possible saline water intrusion or conductive clayey materials. Similar coastal investigations demonstrate that saline saturated sediments generally exhibit low resistivity, although lithological verification is essential (Oladunjoye et al., 2021).
Accordingly,
the deeper conductive zone represents a potential groundwater pollution
hotspot, whereas comparatively resistive zones may indicate less saline
conditions. However, saltwater absence cannot be confirmed from resistivity
alone. Resistivity plot for profiles inverse model has identified a shallow
conductive anomaly (26.8-48.8Ωm) embedded at 1.75-18.2m in the Benin Formation,
which is thought to be a saltwater plume migrating continuously downward (Figure 2). There is
significant agreement between the computed and measured apparent resistivity
pseudosections (RMS error = 2.0%), which supports the idea of inversion
fidelity. Around 30% of coastal aquifers in the Niger Delta are affected by
salinisation, and this phenomenon is well documented there as well (Udom
et al., 2002). It
is represented by a saline wedge that uses near-surface permeable pathways, in
contrast to higher-resistivity freshwater bearing strata (>134Ωm). From a
hydrogeological perspective, the polluted interval does not meet the potability
criteria set by the World Health Organization (2000) for total dissolved solids
(TDS) and chloride, and the abnormally high levels of sodium (Na+)
cause the SAR values to be unsustainable, which goes against the standards set
by the National Solid Waste Qualifications 2007. The Benin Formation is
vulnerable to tidal force and human over abstraction, as shown by the downward
migratory track. Sustainability in groundwater management calls for controlled
extraction and ongoing geophysical monitoring, according to these results,
which are in line with recent ERT based evaluations (Ohwoghere-Asuma et al.,
2023; Ekwok et al., 2022) and the hydrogeological synthesis (Nwankwo et
al., 2023) (Table 1 and 2).
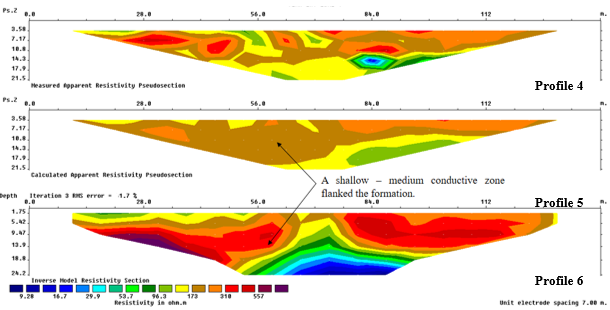
Figure 3: Resistivity plot for profiles.
The inverted section of Resistivity plot for profiles 4-6 indicates two principal subsurface sequences. The upper sequence, extending from the surface to approximately 5-9 m, represents topsoil and shallow sediments, with resistivity varying broadly from 96.3 to above 557 Ωm in the more resistive zones. The second sequence comprises clayey or clay-rich sediments and potentially saline-saturated materials, particularly within the central and deeper portions of the profile 4-6, extending to approximately 24.2 m. The deepest conductive anomaly, with resistivity of approximately 9.28-29.9 Ωm, suggests a potential saltwater affected or polluted zone. Conversely, relatively resistive areas may indicate less conductive, potentially freshwater bearing materials. Similar coastal studies associate low resistivity with saline intrusion but the need for lithological and hydrochemical confirmation (Ayolabi et al., 2013; Bayode et al., 2020). Clay content may also explain the conductive anomaly; therefore, groundwater EC and chloride measurements are recommended. A shallow to medium conductive zone (5.28-29.9Ωm) is indicated by the Resistivity plot for profiles inverse model, which is believed to be a saltwater plume that is expanding laterally and taking advantage of marginal paths. This zone is flanked by the Benin Formation at a depth of 1.75-13.9m (Figure 3). Inversion fidelity is supported by the substantial convergence of the observed and estimated pseudosections (RMS error = 1.7%). In the Niger Delta, where geological diversity makes aquifers more susceptible to flooding, a saline wedge has been found to migrate through paleo channel discontinuities, as indicated by this low resistivity horizon, which is in contrast to the higher resistivity central strata (>96.3Ωm) (Ohwoghere-Asuma et al., 2023). In terms of hydrogeology, the polluted interval doesn't meet the potability criteria set by the World Health Organization (2000) for TDS and chloride, and the guidelines set by the National Solid Waste Quality Review (2007) for sustainable SAR values are violated by the increased Na⁺ concentrations. Table 1-2 shows that coastal aquifers are vulnerable to tidally induced encroachment due to the lateral flanking design. This research confirms what previous ERT-based evaluations by Ekwok et al., (2022) and hydrogeological synthesis by Nwankwo et al., (2023) have shown: that strategic controlled extraction and constant geophysical monitoring are essential for sustainable groundwater governance.
Statistics of Physico-Chemical Parameters of
Irrigation Water
Descriptive
statistics (Table 1) reveal a dataset dominated by strong positive skewness,
reflecting the coexistence of minimally impacted wells and heavily mineralized
boreholes within the same coastal corridor. Temperature was essentially
invariant (mean 28.18 ± 0.45 °C; CV = 1.6%), consistent with equatorial shallow
aquifer conditions, whereas EC and TDS exhibited the highest dispersion in the
dataset (EC: 77-7,490 µS/cm, CV = 132%; TDS: 40-3,750 mg/L, CV = 148%),
confirming the spatially heterogeneous salinization documented for the Niger
Delta coastal belt (Eyankware et al., 2021; Udota et al., 2022).
Table 1: The Hydrochemical Analyzed Parameters Table
|
S/N |
Parameter |
Symbol |
Unit |
BH1 |
WELL1 |
BH2 |
WELL2 |
BH3 |
WELL3 |
BH4 |
WELL4 |
BH5 |
WELL5 |
BH6 |
WELL6 |
WHO |
NSDWQ |
|
|
Latitude |
4°48'46"N |
4°48'46"N |
4°48'46"N |
4°46'57"N |
4°46'57"N |
4°45'50"N |
4°45'50"N |
4°44'41"N |
4°44'41"N |
4°44'42"N |
4°44'42"N |
4°47'51"N |
||||||
|
Longitude |
6°49'49"E |
6°49'49"E |
6°49'49"E |
6°48'59"E |
6°48'59"E |
6°50'25"E |
6°50'25"E |
6°51'02"E |
6°51'02"E |
6°50'59"E |
6°50'59"E |
6°46'33"E |
||||||
|
Elevation |
20m |
20m |
20m |
13m |
13m |
10m |
10m |
0m |
0m |
0m |
0m |
10m |
||||||
|
1 |
Temp. |
-- |
oC |
28.3 |
28.5 |
28.4 |
27.8 |
29.2 |
27.8 |
28.3 |
28.1 |
28.3 |
27.7 |
27.5 |
28.2 |
NS |
NS |
|
|
2 |
EC |
-- |
µS/cm |
6530 |
229 |
77 |
7490 |
529 |
596 |
1120 |
428 |
985.8 |
897.6 |
3763 |
596 |
NS |
<1000 |
|
|
3 |
pH |
-- |
-- |
6.39 |
6.65 |
6.26 |
6.44 |
7.09 |
6.92 |
7.01 |
6.99 |
5.37 |
6.17 |
6.66 |
6.92 |
6.5–8.5 |
6.5–8.5 |
|
|
4 |
TDS |
-- |
mg/L |
3270 |
114 |
40 |
3750 |
50 |
296 |
559 |
214 |
50 |
43 |
2733 |
296 |
<1000 |
<500 |
|
|
5 |
Salinity |
-- |
mg/L |
3310 |
114 |
40 |
3810 |
50 |
298 |
556 |
215 |
50 |
44 |
2712 |
298 |
NS |
<500 |
|
|
6 |
Sodium |
Na |
mg/L |
242.7 |
36.3 |
24.75 |
365 |
88.6 |
97.3 |
189.8 |
78.8 |
20.5 |
55.7 |
232 |
22 |
<200 |
<200 |
|
|
7 |
Calcium |
Ca |
mg/L |
6.07 |
3.84 |
6.75 |
6.88 |
5.54 |
2.03 |
9.33 |
8.63 |
6.87 |
5.73 |
4.78 |
8.45 |
NS |
<75 |
|
|
8 |
Magnesium |
Mg |
mg/L |
2.24 |
6.65 |
5.76 |
4.62 |
4.64 |
8.63 |
6.87 |
6.92 |
5.77 |
5.76 |
7.32 |
4.42 |
NS |
<50 |
|
|
9 |
Sulphate |
SOâ‚„ |
mg/L |
23.74 |
67.77 |
26.72 |
8.98 |
23.22 |
24.03 |
91.33 |
84.63 |
60.87 |
65.73 |
53.77 |
72.78 |
<250 |
<100 |
|
|
10 |
Nitrate |
NO |
mg/L |
2.03 |
9.33 |
8.63 |
6.87 |
5.73 |
9.76 |
8.23 |
7.34 |
4.66 |
6.74 |
5.76 |
4.43 |
<50 |
<50 |
|
|
11 |
Chloride |
Cl |
mg/L |
147.63 |
86.68 |
103.87 |
146.85 |
25.7 |
56.33 |
103.5 |
50.67 |
112.7 |
127.9 |
145.4 |
53.22 |
<250 |
<250 |
|
|
12 |
Bicarbonate |
HCO |
mg/L |
103.36 |
88.8 |
84.22 |
121.58 |
112.02 |
238.7 |
123.5 |
98.2 |
83.9 |
89.8 |
93.7 |
66.7 |
NS |
NS |
|
|
13 |
Iron |
Fe |
mg/L |
0.22 |
0.46 |
0.42 |
0.19 |
0.44 |
0.32 |
0.29 |
0.3 |
0.42 |
0.53 |
0.31 |
0.44 |
<0.3 |
<0.3 |
|
|
14 |
Nickel |
Ni |
mg/L |
BDL |
BDL |
BDL |
BDL |
BDL |
BDL |
BDL |
BDL |
BDL |
BDL |
BDL |
BDL |
<0.02 |
<0.02 |
|
|
15 |
Cadmium |
Cd |
mg/L |
0.001 |
0.0001 |
0.0001 |
BDL |
BDL |
BDL |
BDL |
BDL |
BDL |
BDL |
BDL |
BDL |
<0.003 |
<0.003 |
|
|
16 |
Copper |
Cu |
mg/L |
BDL |
0.32 |
0.65 |
0.32 |
BDL |
BDL |
BDL |
BDL |
BDL |
BDL |
BDL |
BDL |
<1.0 |
<1.0 |
|
|
17 |
Potassium |
K |
mg/L |
5.03 |
6.21 |
4.74 |
7.73 |
6.22 |
6.65 |
5.34 |
6.33 |
3.23 |
2.43 |
3.67 |
3.44 |
NS |
<12 |
|
|
18 |
Lead |
Pb |
mg/L |
BDL |
BDL |
BDL |
BDL |
BDL |
BDL |
BDL |
BDL |
BDL |
BDL |
BDL |
BDL |
<0.01 |
<0.01 |
|
|
19 |
BOD |
-- |
mg/L |
5.12 |
1.43 |
0.87 |
6.22 |
2.7 |
2.91 |
3.24 |
1.23 |
0.65 |
1.72 |
4.67 |
0.23 |
NS |
NS |
|
|
20 |
COD |
-- |
mg/L |
10.3 |
2.5 |
1.72 |
13 |
6.3 |
3.3 |
5.93 |
3.22 |
1.12 |
3.44 |
9.98 |
2.23 |
NS |
<10 |
|
|
— |
SAR |
— |
— |
21.38 |
2.6 |
1.69 |
26.38 |
6.71 |
6.64 |
11.49 |
4.84 |
1.39 |
3.93 |
15.56 |
1.53 |
<10 |
NS |
|
Mean pH (6.57 ± 0.49) was marginally acidic and within the 6.5-8.5 window recommended for irrigation (Ayers & Westcot, 1985), although BH5 (Ido, 5.37) fell below it. Sodium (121.12 ± 110.95 mg/L; CV = 92%) and chloride (96.70 ± 42.20 mg/L) displayed wide ranges with three Na exceedances of the NSDWQ (2007) limit. The sodium adsorption ratio averaged 8.68 ± 8.34 (CV = 96%), with BH2 (Tema) recording 26.38 a value within Richards' (1954) S3 ("high sodium hazard") class, indicating that direct use of such water on fine textured deltaic soils risks permeability decline and sodicity. Conversely, hardness parameters (Ca: 6.24 ± 2.08; Mg: 5.80 ± 1.67 mg/L) were low and uniform (CV < 35%), while nitrate (6.63 ± 2.25 mg/L) remained far below the 50 mg/L threshold, suggesting negligible agrochemical loading relative to salinity stress. Organic loading (BOD: 2.58 ± 1.92; COD: 5.25 ± 3.90 mg/L) was moderate but exceeded the COD irrigation guideline of 10 mg/L at BH1 and BH2. The statistics characterize a salinity limit, sodium hazard dominated irrigation water suite, in agreement with regional irrigation suitability assessments by Egbueri et al., (2024), and underscore that salinity management rather than nutrient or pathogen control constitutes the primary constraint on agricultural reuse of these waters.
Spatial Distribution of Groundwater Salinity
The spatial
distribution of groundwater salinity across the study area (Figure 4) reveals a markedly heterogeneous contamination regime, with
discrete thermal like hotspots of extreme ionic enrichment that substantially
transgress the Nigerian Standard for Drinking Water Quality (NSDWQ, 2007)
threshold of <500 mg/L. The most pronounced salinity anomalies are
concentrated at Tema (Well 2: 3,810 mg/L), Sama (BH1: 3,310 mg/L), and Ido
(BH6: 2,712 mg/L), which collectively define a bifocal plume architecture
exceeding the regulatory limit by factors of 5.4 to 7.6 (Figure 4). These
extreme values are diagnostic of active saltwater intrusion or anthropogenic
saline loading, consistent with regional findings that coastal aquifers of the
Niger Delta Benin Formation exhibit low longitudinal conductance and high
vulnerability to salinization due to permeable overburden and proximity to
marine interfaces (Nkpoidet et al., 2025). By contrast, samples from Sama (BH2:
40 mg/L; Well 1: 114 mg/L), Tema (BH3: 50 mg/L), and Buguma (BH5: 50 mg/L)
register salinity well within the NSDWQ potable envelope, underscoring extreme
spatial heterogeneity at the intra community scale (Table 1 and 2).
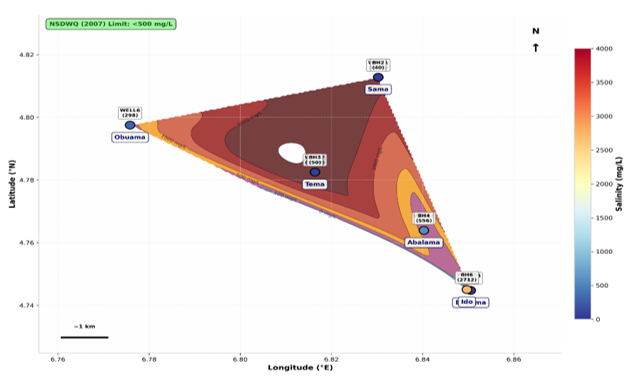
Figure 4: Spatial distribution of Groundwater Salinity Concentration Map for the study area
The spatial gradient manifests a distinct NW-SE vector of increasing salinity, with the highest conductometric signatures clustering around low elevation coastal settlements (Buguma and Ido at 0 m elevation) and extending inland toward Tema and Sama. This topographically controlled distribution corroborates time lapse electrical resistivity investigations that document active lateral salinity changes rapidly intruding freshwater aquifers in southeastern Niger Delta coastal environments (Inim et al., 2020). Notably, the elevated salinity values coincide with high electrical conductivity and total dissolved solids, forming a coherent hydrochemical facies indicative of Na-Cl dominance driven by seawater mixing or evaporite dissolution (Omajene et al., 2024). The NSDWQ (2007) threshold, although not exceeded in all sampling points, is breached at four distinct locations, signifying that approximately one-third of the monitored aquifer units are already compromised. The concentration map thus captures a transitional hydrogeological state wherein fragmented freshwater lenses are progressively assimilated by encroaching conductive fronts, necessitating immediate aquifer vulnerability assessment and regulated extraction to avert total potable collapse (Nkpoidet et al., 2025).
The spatial distribution of
hydrochemical parameters across the study area reveals a tripartite zonation
reflecting differential contamination vectors and aquifer vulnerability within
the Niger Delta Benin Formation (Figure 5). The Northwest cluster
(Obuama) registers consistently moderate signatures, with Well 6 exhibiting
electrical conductivity (596 µS/cm), total dissolved solids (296 mg/L), and
salinity (298 mg/L) within or marginally approaching potable thresholds,
alongside a low sodium adsorption ratio (SAR = 1.53), indicating minimal sodium
hazard. This cluster represents the least compromised hydrogeological regime,
likely benefiting from greater topographic elevation (10 m) and distance from
saline intrusion fronts.
The Central cluster
(Tema-Abalama) manifests extreme spatial bifurcation, a hallmark of point
source contamination superimposed on regional salinization. Tema Well 2
registers the most severe deterioration across all parameters (EC 7,490 µS/cm;
TDS 3,750 mg/L; salinity 3,810 mg/L; Na⁺ 365 mg/L; SAR 26.38),
exceeding NSDWQ (2007) limits by an order of magnitude, whereas adjacent BH3
maintains pristine conditions (EC 529 µS/cm; TDS 50 mg/L). This intra-community
disparity is consistent with hydrochemical investigations documenting that
Na-Cl facies in the Niger Delta arise from both saltwater intrusion and
anthropogenic effluent discharge, with spatial heterogeneity driven by
preferential flow pathways and differential aquifer confinement (Odesa 2024). Abalama exhibits
intermediate degradation (BH4: EC 1,120 µS/cm; salinity 556 mg/L), suggesting
progressive plume encroachment (Table 2).
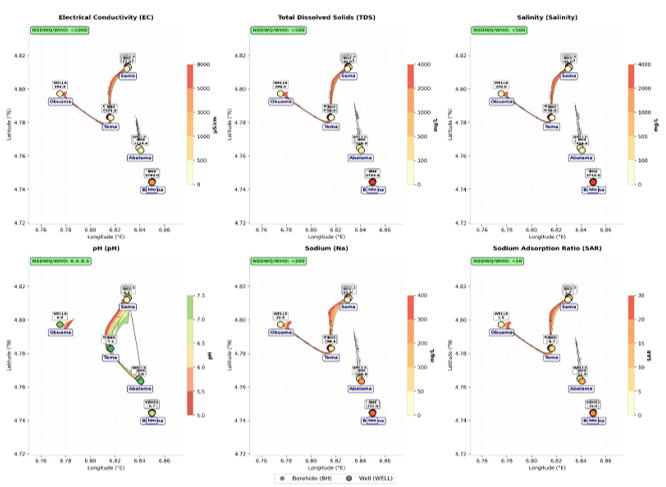
Figure 5: comprehensive Spatial Distribution Map of hydrochemical parameters across the study area
Table 2: Spatial interpolation of critical hydrochemical parameters across the study area
|
Panel |
Parameter |
NSDWQ/WHO Threshold |
Key Observations |
|
(a) |
Electrical Conductivity
(EC) |
<1000 µS/cm |
Extreme hotspots at Tema
Well 2 (7,490) and Sama BH1 (6,530), indicating severe ionic enrichment |
|
(b) |
Total Dissolved Solids
(TDS) |
<500 mg/L |
Sama BH1 (3,270, Tema
Well 2 (3,750), and Ido BH6 (2,733) exceed limits by 5–7.5× |
|
(c) |
Salinity |
<500 mg/L |
Same hotspots as TDS;
Buguma BH5 (50) and Sama BH2 (40) remain pristine |
|
(d) |
pH |
6.5–8.5 |
Buguma BH5 (5.37) is
strongly acidic; most other samples fall within acceptable range |
|
(e) |
Sodium (Na⁺) |
<200 mg/L |
Tema Well 2 (365) and
Sama BH1 (242.7) breach the threshold, consistent with Na-Cl facies |
|
(f) |
Sodium Adsorption Ratio
(SAR) |
<10 |
Sama BH1 (21.38 Tema Well
2 (26.38), and Ido BH6 (15.56) indicate high sodium hazard for irrigation |
The Southeast cluster (Buguma-Ido) at 0 m elevation demonstrates coastal aquifer vulnerability, with Ido BH6 registering elevated TDS (2,733 mg/L), salinity (2,712 mg/L), and SAR (15.56), indicative of density driven saltwater intrusion. Buguma remains comparatively moderate, though BH5 exhibits anomalous EC (985.8 µS/cm) despite low TDS, possibly reflecting conductive ionic species from surficial contamination. The collective spatial gradient intensifying from northwest to southeast corroborates regional models attributing coastal groundwater degradation to marine intrusion exacerbated by low topographic relief and excessive extraction (Hagage et al., 2024). The tripartite zonation thus captures a continuum from relatively protected inland reserves to actively salinizing coastal aquifers, mandating differentiated management strategies.
The geospatial distribution
of sodium and chloride across the six coastal communities delineates a
salinization gradient that is strongly conditioned by proximity to tidal
conduits and shoreline position. Sodium concentrations exceed the NSDWQ (2007)
permissible limit of 200 mg/L at BH1 (Sama, 242.7 mg/L), BH2 (Tema, 365 mg/L)
and Well 6 (Ido, 232 mg/L), with the two former sites occupying the western,
ocean facing and river channel axis through which Atlantic water propagates
during tidal flooding. This spatial correspondence is consistent with the
landward salt-influx mechanism documented for the Niger Delta by (Abam 2001 and
Abam et al., 2025) and empirically imaged at Okrika and Bonny by (Abija et al.,
2021 and Udota et al., 2022). Chloride, although below the 250 mg/L threshold
at all stations, exhibits a coherent eastward elevating band (112–148 mg/L)
tracking the tidal creek system, while the most inland station (Obuama) records
the lowest values a distance decay pattern diagnostic of marine influence.
Critically, the decoupled high-chloride/low-sodium signature at BH4 (Buguma; Cl
= 112.7 mg/L, Na = 20.5 mg/L) departs from the coupled Na-Cl enrichment
expected of seawater mixing (Na⁺/Cl⁻ ≈ 0.86), implying a non-marine chloride
source such as connate brackish water, mineral leaching, or anthropogenic
input. The anomously high sodium at Well 6 is relatives to its paired borehole
(BH5) further suggests localized well specific contamination rather than
regional intrusion. Collectively, the dataset indicates spatially heterogeneous
salinization in which active tidal intrusion, paleo saline beds and point
source pollution interact, underscoring the necessity of ionic ratio and
isotopic verification before ascribing salinity to seawater intrusion alone
(Figure 6).
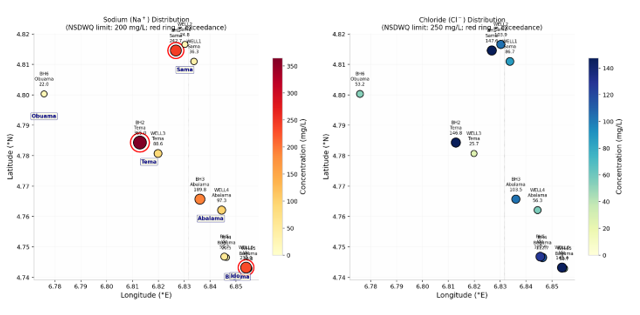
Figure 6: Geospatial distribution of sodium and Chlorine
Conclusion
This study integrated 2-D
electrical resistivity tomography, vertical electrical sounding and groundwater
hydrochemistry to evaluate saltwater intrusion in some coastal areas in Rivers
State, Nigeria. Low-resistivity zones (0.678–48.8 Ωm) were interpreted as
saline wedges exploiting palaeo channel discontinuities, and inversion models
were reliable (RMS 1.4-7.6%). Hydrochemical results showed marked spatial
heterogeneity: Tema Well 2 recorded an EC of 7,490 µS/cm and a salinity of
3,810 mg/L, while adjacent BH3 remained within potable limits. Salinity, sodium
and SAR exceedances were concentrated at Tema, Sama and Ido, and a tripartite
zonation of water quality was identified. Vulnerability appears controlled by
low topographic relief, aquifer confinement and tidal proximity, with isolated
freshwater lenses increasingly threatened by diffusive encroachment. Because
low resistivity may also reflect clay content, ionic-ratio and isotopic
verification are recommended. Regulated abstraction and continuous geophysical
monitoring are essential for sustainable groundwater management.
Declaration of Competing Interest
The
authors declare that they have no known competing financial interests or
personal relationships that could have appeared to influence the work reported
in this paper.
References
Abam, T. K. S. (2001). Regional hydrological research perspectives in the Niger Delta. Hydrological Sciences Journal, 46(1), 13–25.
Abam, T. K. S., Giadom, F. D., Mogaba, P. M., & Nwankwo, I. L. (2025). Electrical resistivity imaging and lithological modelling of hydrocarbon contaminated soil in Ogoni, Rivers State, Nigeria. International Journal of Research and Innovation in Applied Science, 10(6). https://doi.org/10.51584/IJRIAS.2025.10060005
Abd-Elaty, I., Abd-Elhamid, H. F., & Negm, A. M. (2017). Investigation of saltwater intrusion in coastal aquifers. In A. M. Negm (Ed.), Groundwater in the Nile Delta. Springer International Publishing AG.7(4), 125-135. https://doi.org/10.1007/698_2017_190
Abd-Elhamid, H. F., Abd-Elaty, I., & Negm, A. M. (2018). Control of saltwater intrusion in coastal aquifers. In A. M. Negm (Ed.), Groundwater in the Nile Delta. Springer International Publishing AG. 10(7), 1120-1135. https://doi.org/10.1007/698_2017_138
Abija, F. A., Marshall, H. I., & Udom, G. J. (2021). Sources of Salinization and Investigation of Salt Water Intrusion into Coastal Aquifers in Parts of the Niger Delta, Nigeria. Journal of Hydrogeology & Hydrologic Engineering. SciTechnol
Ayolabi, E. A., Folorunso, A. F., Odukoya, A. M., & Adeniran, A. E. (2013). Mapping saline water intrusion into the coastal aquifer with geophysical and geochemical techniques: the University of Lagos campus case (Nigeria). SpringerPlus, 2, 433. https://doi.org/10.1186/2193-1801-2-433
Ayodele EA; Oyedele KF, Oyeyemi EO, Ewiwile EE. (2003). Geolectric sounding for the determination of groundwater conditions around Iwaya area of Lagos, Nigeria: Glo J Pure and Appl Sci.;9(4): 539-545.
Ayers, R. S., & Westcot, D. W. (1985). Water quality for agriculture (FAO Irrigation and Drainage Paper 29, Rev. 1). Food and Agriculture Organization of the United Nations.
Batayneh A.T. (2006). Use of electrical methods for detecting sub surface fresh and saline water and delineating their interfacial configuration: A case study of the eastern Dead Sea coastal aquifers: Hydro Geo J.;14:1277-1283.
Dickenson, H. D., Oghonyon, R., Itiowe, K., & Nule, H. C. (2022). The use of electrical resistivity method in exploring for aquifer depth in part of Tombia, Degema L.G.A., Rivers State, Nigeria. Equity Journal of Science and Technology, 9(1), 41–46. https://doi.org/10.4314/equijost.v9i1.9
Egbueri, J. C., (2025). Leveraging novel machine learning models in predicting groundwater irrigation suitability in southeastern Nigeria. Groundwater for Sustainable Development. https://doi.org/10.1016/j.gsd.2025.101164
Ekwok, S. E., Ben, U. C., Eldosouky, A. M., (2022). Towards understanding the extent of saltwater incursion into the coastal aquifers of Akwa Ibom State, Southern Nigeria using 2D ERT. Journal of King Saud University – Science, 34(8), 102371.
Eyankware, M. O., Akakuru, C. O., Ulakpa, R. O. E., & Eyankware, E. O. (2021). Sustainable management and characterization of groundwater resource in the coastal aquifer of Niger Delta basin, Nigeria. Sustainable Water Resources Management, 7(4), 58.
Frohlich RK, Urish DW. The use of geoelectrics and test wells for the assessment of groundwater quality of a coastal industrial site: J Appl Geo Phy.2002;50:261–278.
Hagage, M., . Abdulaziz M, Elbeih S.F.& Hewaidy, A. A. (2024). Monitoring soil salinization and waterlogging in the northeastern Nile Delta linked to shallow saline groundwater and irrigation water quality. Scientific Reports, 14, 27954. https://doi.org/10.1038/s41598-024-77954-x
Inim, I. J., Udosen, N. I., Tijani, M. N., Affiah, U. E., & George, N. J. (2020). Time-lapse electrical resistivity investigation of seawater intrusion in coastal aquifer of Ibeno, Southeastern Nigeria. Applied Water Science, 10(11), 232. https://doi.org/10.1007/s13201-020-01316-x
Nkpoidet, M. M., (2025). Hydrodynamic and stratigraphic evaluation of marine saline intrusion into the coastal groundwater systems of a major crude oil production region in Southern Nigeria. Discover Applied Sciences. https://doi.org/10.1007/s43832-025-00250-w
Nwankwoala, I. L., Abam, T. K. S., & Giadom, F. D. (2023). Challenges of Groundwater Development and Supply in the Niger Delta, Nigeria. Journal of Water Resource and Protection, 15(6).
Obunadike, C., Akerele, D. D., Abiodun, O. P., Olisah, S., Oloyede, K., Obunadike, S. E., & Obunadike, J. C. (2024). An assessment of saltwater intrusion in coastal regions of Lagos, Nigeria. Journal of Geoscience and Environment Protection, 12, 93–119. https://doi.org/10.4236/gep.2024.121007
Odesa (2024). Assessment of groundwater samples in the Niger Delta. Global Journal of Environmental Science and Sustainability, 1(1), 76–92.
Odigie, O., & Obayagbona, N. O. (2025). Saltwater intrusion in Nigeria: A review. ETSJ, 16(1).
Oghonyon, R., Dickenson, D. H., & Braide, I. T. D. (2024). Evaluation of saltwater intrusion in groundwater at Bakana, Rivers State. International Journal of Scientific Research and Engineering Development, 7(5), 546–562.
Ohwoghere-Asuma, O., (2023). Surficial survey of unstressed aquifers for saltwater–freshwater interaction using 2D inverse resistivity model and saltwater markers in the coastal area of Ogheye, Niger Delta Basin, Nigeria.
Oladunjoye, M. A., et al. (2021). Time-lapse electrical resistivity investigation of seawater intrusion in coastal aquifer of Ibeno, Southeastern Nigeria. Applied Water Science.
Omajene, A., Egbaljames, C., & Okolie, E. C. (2024). Geophysical and physiochemical approach combined with machine learning prediction and feature classifiers for saltwater intrusion in freshwater aquifers in the Niger Delta, Nigeria. International Journal of Scientific and Academic Research, 2631.
Standards Organisation of Nigeria. (2007). Nigerian standard for drinking water quality (NIS 554:2007). SON. "National Solid Waste Quality Review (2007)" in your file looks like a mislabel of this, so cite it as NSDWQ (2007) throughout.
Udom, G. J., Ushie, F. A., Esu, E. O., (2002). A Geochemical Survey of Groundwater in Khana and Gokana Local Government Areas of Rivers State, Nigeria. Journal of Applied Sciences and Environmental Management, 6(1), 53–59. DOI: 10.4314/jasem.v6i1.17196.
Udota, B. S., Atuchukwu, A. G., Amechi, B. U., & Horsfall, O. I. (2022). Investigation of saline water intrusion in selected coastal area of Rivers State, South-South Nigeria. Earth Sciences Malaysia, 6(1), 56–65. https://doi.org/10.26480/esmy.01.2022.56.65
Uzoije, A. P., Onunkwo-A., A. A., Uche, C. C., & Ashiegbu, D. (2014). Evaluation of groundwater quality of coastal aquifer systems in Buguma City, Rivers State South-Southern Nigerian. Civil and Environmental Research, 6(7)., 150-165.
Vuong, T. C., Nguyen, K. L., Vu, H. N., Dinh, N. Q., & Truong, V. A. (2021). Investigation of saltwater intrusion in Thach Han River system by MIKE HYDRO River package. Transport and Communications Science Journal, 72(1), 46–57. https://doi.org/10.47869/tcsj.72.1.6
How to Cite This Article
Tariah, D. I., Udom,
G. J. and Okengwu, K. O. (2026).
Evaluation of Saltwater Intrusion in Some Coastal Areas in Rivers State,
Nigeria. Hydrogeology
and Watershed Sciences, 3(1), 10-20. https://doi.org/10.70726/hws.2026.7749002