
Evaluation of Drinking Water Consumption Pattern of Urban Water System Among Households in Abuja Metropolis, Nigeria
- a Institute of Natural Resources, Environment and Su, University of Port Harcourt
- b University of Port Harcourt
Highlights
- Evaluated household drinking-water consumption patterns and perceptions in Abuja, Nigeria.
- 50.4% of households did not check water quality, while 51.2% did not treat their water.
- 89.3% considered the supplied water unpleasant in taste or smell.
- 73.6% mainly used supplied water for cooking and bathing.
- Improved public perception, water treatment, and confidence in urban water safety are needed.
Abstract
Keywords
Introduction
Water is an essential constituent of all living organisms on the earth and is most significant for humans for adequate life (Rahman et al., 2011; Arain et al., 2014). One of the sixth Sustainable Development Goal (SDG) targets to ensure the availability and sustainable management of water and sanitation for all is universal access to safe and affordable drinking water by 2030 (Okoh et al., 2021). An important measure to determine access to safe drinking water is access to an improved water source. Water is connected to every form of life on earth. As criteria, an adequate, reliable, clean, accessible, acceptable and safe drinking water supply has to be available for various users. The United Nations (UN) and other countries declared access to safe drinking water a fundamental human right and an essential step towards improving living standards (Addisie, 2022). The development of every growing nation largely relies on the government’s ability to improve the quality of water, water sources and socioeconomic living standards (Nerkar et al., 2013; Kwang et al., 2018). An enhanced water supply indicates the presence of an efficient and functioning public stand-post/pipe, a borehole, a protected spring or well, or collected rainwater, which is considered hygienic. However, contaminants in water sources may lead to declining water quality standards, especially when households lack access to water from improved sources (Kwang et al., 2018). An important measure to determine access to safe drinking water is access to an improved water source. These improved water sources include household connections to municipal water supply, public standpipe or tap, tube wells or boreholes, protected dug wells, protected springs, rainwater and bottled water. Unimproved sources include unprotected wells, unprotected springs, vendor-provided water, tanker truck-provided water, surface water, sachet water and other sources (Okoh et al., 2021).
Drinking water quality should meet physicochemical pollutants criteria and be entirely free of pathogens that could harm people’s health. Furthermore, user perceptions of water quality are critical to the long-term viability of drinking water sources (Ochoo et al., 2017; Sherry et al., 2019). The aesthetic value of water in terms of flavour, odour, and appearance is viewed differently by different households (WHO/UNICEF, 2013; Wedgworth et al., 2014; Addisie, 2022). Consumer perceptions and aesthetic characteristics should be addressed when examining drinking water sources, even if they do not negatively influence human health (WHO, 2018; Addisie, 2022).
Consumers' perspectives on drinking water quality are based on common observations of its colour and taste without necessarily considering the physical, chemical, and microbial characteristics that guarantee that water is of good quality (Bashiru et al., 2023). These factors considered by consumers regarding the quality of drinking water, such as taste, odour, and colour, can influence users’ decisions, satisfaction, and willingness to choose between water sources (Bashiru et al., 2023). Some of these characteristics could result in long-term public health hazards. Water that has changed in appearance and taste, as well as water that smells bad, may be considered by consumers to be unsafe (World Health Organization, 2014). Therefore, the study evaluates the drinking water consumption pattern of the urban water systems among households in the Abuja metropolis, Nigeria.
Materials and Methods
Study Area
Abuja, located centrally in Nigeria, is the nation's capital city (Figure 1). Kaduna borders Abuja to the north, Niger state to the west, Nasarawa state to the east and southeast, and Kogi state to the southwest. Abuja was officially named the capital of Nigeria on December 12, 1991 (Wambebe & Duan, 2020). Abuja is the administrative and political centre of Nigeria, situated at GPS coordinates 9°5′ N 7°32′ E. The overall land area is 7315 km2 (2824 sq. mi), according to Wambebe & Duan (2020). Abuja's population currently surpasses 2.5 million people, according to Wambebe & Duan (2020).
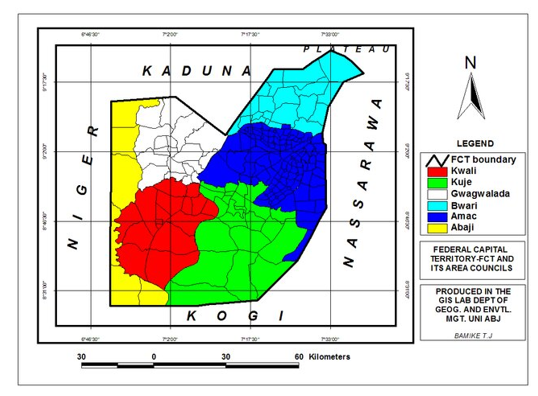
Figure 1: Overview of the Study Area
Sample Size and Data Collection
A cross-sectional survey research design was conducted among 12 wards from Abuja Municipal Area Council (AMAC), which were randomly selected and cut across four (4) districts. One hundred and eighty (180, that is, 15 household heads from each ward) respondents (household heads) were selected and a simple random sampling technique was adopted to select the respondents.
A questionnaire was used to elicit information from households (respondents) regarding the consumers’ drinking water consumption patterns. The questionnaire adopted for the study used a closed-ended format. The reliability of the questionnaire was achieved through a pilot survey based on a test-retest approach. The two outcomes showed a reliability coefficient of 0.7, indicating consistency with the response.
Data Analysis
The retrieved questionnaires were coded and subjected to the Statistical Package for the Social Sciences (SPSS v.21) for proper analysis. Descriptive statistics such as frequency count and percentage were adopted, and findings were presented through tables. Using such statistics allows the researcher to present the study's evidence understandably and make conclusions concerning the study's variables.
Results and Discussion
The consumer consumption pattern of the drinking water supply was examined, and the outcome was presented in Table 1. From the outcome, 24.0% of the respondents indicated carrying out a water quality check of the received water, 50.4% of the respondents do not carry out a water quality check, while 19.8% and 5.8% are not sure and do it occasionally, respectively. 30.6% of the respondents indicated that they treat borehole water only, 8.3% indicated treating public water, while 9.9% and 51.2% of the respondents indicated treating both borehole and public water and no treatment of either water source, respectively. 47.9% of the respondents indicated carrying out a specific treatment before using the water for drinking or bathing with the supply water, while 52.1% of the respondents did not carry out any particular treatment. From the analysis, 12.4% of the respondents drink the supplied water daily, while 14.0% and 73.6% indicated not drinking the water and use it only for cooking and bathing, respectively. 10.7% of the respondents indicated that the water was tasty and smelly while drinking the water, while 89.3% indicated that the water was not tasty and smelly.
Table 1: Consumers’ Consumption Pattern of the Drinking Water Quality
|
Variable |
Frequency (n=121) |
Percentage (%) |
|
|
Carry Out Water Quality |
|
|
|
|
Yes |
29 |
24.0 |
|
|
No |
61 |
50.4 |
|
|
Not sure |
24 |
19.8 |
|
|
I do it occasionally |
7 |
5.8 |
|
|
Carry out Water Treatment |
|
|
|
|
Yes, treat the Borehole only |
37 |
30.6 |
|
|
Yes, treat the Public Water |
10 |
8.3 |
|
|
Yes, treat both because treatment is carried |
12 |
9.9 |
|
|
No |
62 |
51.2 |
|
|
Specific Treatment before Drinking or Other Use (e.g. Bathing) |
|
||
|
Yes |
58 |
47.9 |
|
|
No |
63 |
52.1 |
|
|
Using the Supply Water for Drinking Purposes (Often) |
|
||
|
Daily- Main Drinking Water |
15 |
12.4 |
|
|
Not Often- Not Main Drinking Water |
17 |
14.0 |
|
|
Cooking and Bathing Only |
89 |
73.6 |
|
|
Tasty or Smelly Feeling While Drinking the Water |
|
||
|
Yes |
13 |
10.7 |
|
|
No |
108 |
89.3 |
|
|
Ever Experience Health Issue due to Drinking or Bathing the Water |
|||
|
Yes |
30 |
24.8 |
|
|
No |
80 |
66.1 |
|
|
Maybe |
11 |
9.1 |
|
|
Household Member Ever Experience |
|||
|
Dry or Itching Skin |
27 |
22.3 |
|
|
Itching or dry hair |
4 |
3.3 |
|
|
Stomach Upset |
23 |
19.0 |
|
|
Not Sure |
67 |
55.4 |
|
|
Ever Spend Money on Water Treatment |
|
|
|
|
Yes |
52 |
43.0 |
|
|
No |
69 |
57.0 |
|
|
Amount Spent Annually on Water Treatment |
|
||
|
Less Than N50, 000 |
17 |
14.0 |
|
|
N51, 000 – N100, 000 |
30 |
24.8 |
|
|
N101, 000 – N150, 000 |
38 |
31.4 |
|
|
N151,000 – N200, 000 |
14 |
11.6 |
|
|
Above N200,000 |
22 |
18.2 |
|
|
Amount of Water Use Daily |
|
|
|
|
Yes |
34 |
28.1 |
|
|
No |
63 |
52.1 |
|
|
Maybe |
24 |
19.8 |
|
|
Estimated Amount of Water Used Daily |
|
|
|
|
Less than 100 Litres |
21 |
17.4 |
|
|
101 - 200 Litres |
23 |
19.0 |
|
|
201 - 500 Litres |
44 |
36.4 |
|
|
501 - 1000 Litres |
12 |
9.9 |
|
|
More than 1000 Litres |
21 |
17.3 |
|
Regarding health-related experience, 24.8% of the respondents indicated they had experienced health issues due to drinking or bathing with the water supply, while 66.1% and 9.1% of the respondents had not experienced health issues and were indifferent, respectively. Also, 22.3% of the respondents revealed that household members had experienced dry or itching skin, 3.3% indicated itching and dry hair, while 19.0% and 55.4% of the respondents indicated their household experienced stomach upset and others were not sure, respectively. 43.0% of the respondents stated they had spent money on water treatment, while 57.0% thought otherwise.
Also, 14.0% of the respondent indicated spending less than N50,000 annually, 24.8% indicated spending N51,000 – N100,000 annually on water treatment, 31.4% spend N101,000 – N150,000 annually, while 11.6% and 18.2% of the respondents indicated to pay N151, 000 – N200, 000 and above N200,000 annually on water treatment respectively. Among the respondents, 28.1% revealed that they knew the amount of water they used daily, while 52.1% and 19.8% of the respondents did not know and were not sure of the amount of water they used daily. From the outcome, 17.4% of the respondent suggested that they use less than 100 litres of water daily, 19.0% use 101 – 200 litres, 36.4% of the respondents use 201 – 500 litres, while 9.9% and 17.3% of the respondents use 501 – 1000 litres and above 1000 litres respectively.
The consumer consumption pattern of the supply of drinking water indicated most households do not carry out water quality checks and treatment of water sources. The households showed that the water supply is mainly used for cooking and bathing only, although the households indicated that the water is not tasty and is smelly for drinking purposes. A similar outcome was reported in the study conducted by Edeki et al. (2023), where most respondents indicated that their water supply was colourless, odourless and tasteless. Most households have not experienced health issues due to using water for bathing, cooking, or drinking. Most households indicated spending about N101,000 – N150,000 annually on water treatment, which consumed about 201 – 500 litres daily. According to Delpla et al. (2020), an individual's water satisfaction and consumption behaviour were mediated by the water treatment strategies applied at home (filtering, cooling), knowledge about drinking water quality and production, and risk perception.
Conclusion
The study reflected consumer perception of the urban water system supplied by AMAC, Abuja, Nigeria. The fact remains that safe drinking water is essential for human health; however, consumer perception regarding its taste, odour, and colour can influence users’ decisions, satisfaction, and willingness to choose between water sources. The study indicated the supplied water is mainly used for cooking and bathing only, although the households indicated that the water is not tasty and is smelly for drinking purposes. Therefore, the study concluded that the consumer's water use could be based on their perception of the quality of the water. There is a need for improvement in public perception of the safety of urban water systems. At the same time, households could be encouraged to use water treatment, which will ultimately help consumers reduce their expenses on alternative water sources.
Declaration of Competing Interest
The authors declare that they have no known competing financial interests or personal relationships that could have appeared to influence the work reported in this paper.
Credit Authorship Contribution Statement
Chiatula, E: Conceptualization, Methodology, Formal analysis, Investigation, Resources, Data curation, Visualization, Project administration, Writing - original draft. Udom, G.J and Emujakporue, G.: Supervision, Methodology, Validation, Formal analysis, Data curation, Visualization, Review & Editing.
References
Addisie, M. B. (2022). Evaluating Drinking Water Quality Using Water Quality Parameters and Esthetic Attributes. Air, Soil and Water Research, 15(15), 117862212210750. https://doi.org/10.1177/11786221221075005
Arain, M. B., Ullah, I., Niaz, A., Shah, N., Shah, A., Hussain, Z., Tariq, M., Afridi, H. I., Baig, J. A., & Kazi, T. G. (2014). Evaluation of water quality parameters in drinking water of district Bannu, Pakistan: Multivariate study. Sustainability of Water Quality and Ecology, 3-4, 114–123. https://doi.org/10.1016/j.swaqe.2014.12.005
Bashiru, M., Yendoh, J., Amaasende, J. J. A., Yakubu, A. and Aliu-Musah, Z. (2023). Assessment of Consumer Perceptions on Factors Affecting Drinking Water Quality from Water Vendors in Nalerigu in the North East Region of Ghana. International Journal of Innovative Science and Research Technology, 8 (7)
Delpla, I., Legay, C., Proulx, F., & Rodriguez, M. J. (2020). Perception of tap water quality: Assessment of the factors modifying the links between satisfaction and water consumption behavior. Science of the Total Environment, 722, 137786. https://doi.org/10.1016/j.scitotenv.2020.137786
Edeki, P. E., Isah, E. C., & Mokogwu, N. (2023). Self-Reported Assessment of Sources and Quality of Drinking Water: A Case Study of Sapele Local Government Area, Delta State, Nigeria. Journal of Community Medicine and Primary Health Care, 35(1), 100–111. https://doi.org/10.4314/jcmphc.v35i1.9
Kwang, E., Dun-Dery, E. J., Ojo, L., Amponsah, E., Yeboah, K., Owusu, P. N. and Addo, H. O. (2018). Perception of Households Towards Quality of Water: An Appraisal of Household Drinking Water in Urban Ghana. International Journal of Preventive Medicine Research, 4 (3), 32-40.
Nerkar, S. S., Tamhankar, A. J., Johansson, E., & Lundborg, C. S. (2013). Improvement in health and empowerment of families as a result of watershed management in a tribal area in India - a qualitative study. BMC International Health and Human Rights, 13(1). https://doi.org/10.1186/1472-698x-13-42
Ochoo, B., Valcour, J., & Sarkar, A. (2017). Association between perceptions of public drinking water quality and actual drinking water quality: A community-based exploratory study in Newfoundland (Canada). Environmental Research, 159, 435–443.
Okoh, E. O., Miner, C. A., Ode, G. N., & Zoakah, A. I. (2021). Assessment of Household Management Practices of Drinking Water in Two Selected Rural Communities of Plateau State. Journal of Community Medicine and Primary Health Care, 33(2), 35–51. https://doi.org/10.4314/jcmphc.v33i2.3
Rahman, I. Md. M., Islam, M. M., Hossain, M. M., Hossain, M. S., Begum, Z. A., Chowdhury, D. A., Chakraborty, M. K., Rahman, M. A., Nazimuddin, M., & Hasegawa, H. (2010). Stagnant surface water bodies (SSWBs) as an alternative water resource for the Chittagong metropolitan area of Bangladesh: physicochemical characterization in terms of water quality indices. Environmental Monitoring and Assessment, 173(1-4), 669–684. https://doi.org/10.1007/s10661-010-1414-7
Sherry, J., Juran, L., Kolivras, K. N., Krometis, L. A. H., & Ling, E. J. (2019). Perceptions of water services and innovations to improve water services in Tanzania. Public Works Management & Policy, 24(3), 260–283.
Wambebe, N. M., & Duan, X. (2020). Air Quality Levels and Health Risk Assessment of Particulate Matters in Abuja Municipal Area, Nigeria. Atmosphere, 11(8), 817. https://doi.org/10.3390/atmos11080817
Wedgworth, J. C., Brown, J., Johnson, P., Olson, J. B., Elliott, M., Forehand, R., & Stauber, C. E. (2014). Associations between perceptions of drinking water service delivery and measured drinking water quality in rural Alabama. International Journal of Environmental Research and Public Health, 11(7), 7376–7392.
WHO. (2014). Guidelines for drinking-water quality. World Health Organisation.
WHO, & Unicef. (2013). Progress on Sanitation and Drinking Water 2013 Update. World Health. https://doi.org/http://apps.who.int/iris/bitstream/10665/81245/1/9789241505390_eng.pdf?ua=1
How to Cite This Article
Chiatula, E.T., Udom, G.J., Emujakporue, G. (2024). Evaluation of Drinking Water Consumption Pattern of Urban Water System Among Households in Abuja Metropolis, Nigeria. Environmental Monitoring and Pollution Studies, 1(1), 13- 17. https://doi.org/10.70726/emps.2024.6575003